重要提示:
请勿将账号共享给其他人使用,违者账号将被封禁!
重要提示:
请勿将账号共享给其他人使用,违者账号将被封禁!
 题目内容
(请给出正确答案)
题目内容
(请给出正确答案)
The charts below show the results of a survey about what people of different age groups say makes them most happy. Summarize the information by selecting and reporting the main features, make comparisons where relevant and use the writing skill: combining visual tools with text that we have learned in this unit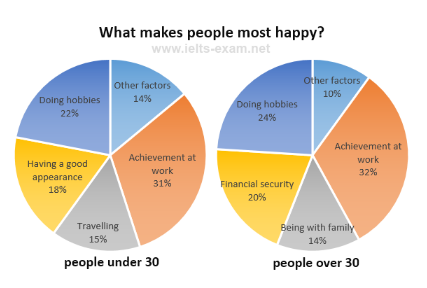
 更多“the charts below show the results of a survey about what people of different age groups sa”相关的问题
第1题
You are to write a report of 160--200 words for a university lecturer describing the information shown below.
A Survey on Adult Education
.jpg)
第2题
第3题
● Which chart does each sentence (11-15) describe?
● For each sentence, mark one letter (A-H) on your Answer Sheet.
● Do not use any letter more than once.
.jpg)
There was no change until the end of the period, when computer sales rose sharply.
第4题
● Which chart does each sentence (11-15) describe?
● For each sentence mark one letter (A-H) on your Answer Sheet.
.jpg)
After a sharp fall in 2000, company profits recovered slightly the following year.
第5题
● Which chart does each sentence (11—15) describe?
● For each sentence mark, mark one letter (A—H) on your Answer Sheet.
● Do net use any letter more than once.
.jpg)
After a sharp drop in 1999, profits recovered for twelve months and then fell again in 2001.
第6题
● which chart does each sentence (11-15) describe?
● For each sentence, mark one letter (A-H) on your Answer Sheet.
● Do not use any letter more than once.
.jpg)
Sales didn't change from 1998 to 2000.
第7题
?Which chart does each sentence (1 -5)describe?
?For each sentence, mark the correct letter(A--H)on your Answer Sheet.
?Do not use any letter more than once.

Bicycle sales hardly changed throughout the period, except for a slight fall in 199
第8题
&8226;Which chart does each sentence (11-15) describe?
&8226;For each sentence, mark the correct letter (A- E) on your Answer Sheet.
&8226;Do not use any letter more than once.

Track sales hardly changed throughout the period, except for a slight fall in 200
第9题
题目要求:
The following chart shows the different attitudes of men and women towards down-to-earth marriage. Look at the chart carefully and write your response in about 200 words, in which you should interpret the chart, state the reasons and give your comments.
Marks will be awarded for content relevance, content sufficiency, organization and language quality. Failure to follow the above instructions may result in a loss of marks.


 客服
客服
 TOP
TOP

 警告:系统检测到您的账号存在安全风险
为了保护您的账号安全,请在“上学吧”公众号进行验证,点击“官网服务”-“账号验证”后输入验证码“”完成验证,验证成功后方可继续查看答案!