重要提示:
请勿将账号共享给其他人使用,违者账号将被封禁!
重要提示:
请勿将账号共享给其他人使用,违者账号将被封禁!
 题目内容
(请给出正确答案)
题目内容
(请给出正确答案)
● Look at the charts below. They show computer sales.
● Which chart does each sentence (11-15) describe?
● For each sentence, mark one letter (A-H) on your Answer Sheet.
● Do not use any letter more than once.
.jpg)
There was no change until the end of the period, when computer sales rose sharply.
 更多“● Look at the charts below. They show computer sales.● Which chart does each sentence (11-”相关的问题
第1题
A.Bar chart.
B.Histogram chart.
C.Line chart.
D.Pie chart.
第2题
&8226;Look at the charts below. They show company profits.
&8226;Which chart does each sentence (11-15) describe?
&8226;For each sentence, mark the correct letter (A-E) on your Answer Sheet.
&8226;Do not use any letter more than once.
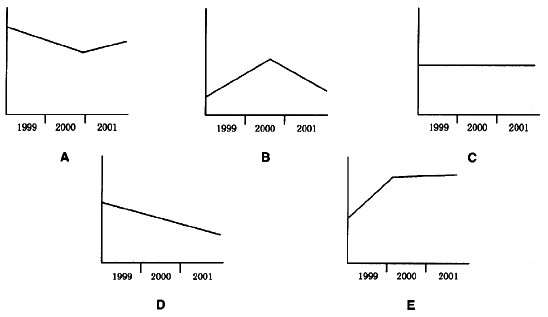
After a sharp fall in 2000, company profits recovered slightly the following year.
第3题
● Look at the charts below. They show the profits of a company.
● Which chart does each sentence (11-15) describe?
● For each sentence mark one letter (A-H) on your Answer Sheet.
.jpg)
After a sharp fall in 2000, company profits recovered slightly the following year.
第4题
● Look at the charts below. They show company sales.
● which chart does each sentence (11-15) describe?
● For each sentence, mark one letter (A-H) on your Answer Sheet.
● Do not use any letter more than once.
.jpg)
Sales didn't change from 1998 to 2000.
第5题
Questions 11-15
&8226;Look at the charts below. They show company sales.
&8226;Which chart does each sentence (11-15) describe?
&8226;For each sentence, mark one letter (A-E) on your Answer Sheet.
&8226;Do not use any letter more than once.
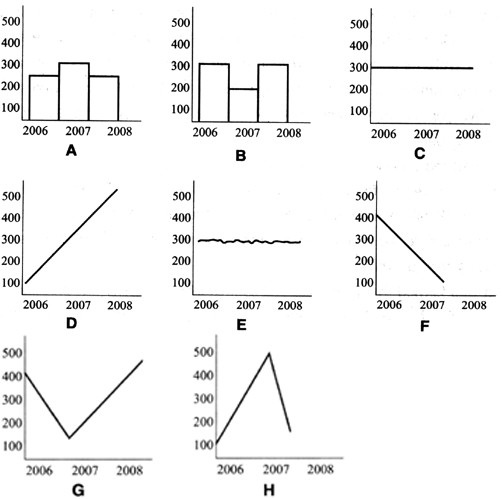
Sales didn't change from 2006 to 200
第6题
● Look at the charts below. They show company profits.
● Which chart does each sentence (11—15) describe?
● For each sentence mark, mark one letter (A—H) on your Answer Sheet.
● Do net use any letter more than once.
.jpg)
After a sharp drop in 1999, profits recovered for twelve months and then fell again in 2001.
第7题
Questions 11-15
&8226;Look at the charts below. They show the sales of cars in different department stores during 2006, 2007 and 2008.
&8226;Which chart does each sentence (11-15) describe?
&8226;For each sentence, mark the correct letter (A-H) on your Answer Sheet.
&8226;Do not use any letter more than once.

Bicycle sales hardly changed throughout the period, except for a slight fall in 200
第8题
Questions 11-15
?Look at the charts below. They show the income from sales and the income from advertisements in eight different newspapers over a three-month period in 2008.
?Which chart does each sentence (11-15) describe?
?For each sentence, mark one letter (A-H).
?Do not use any letter more than once.
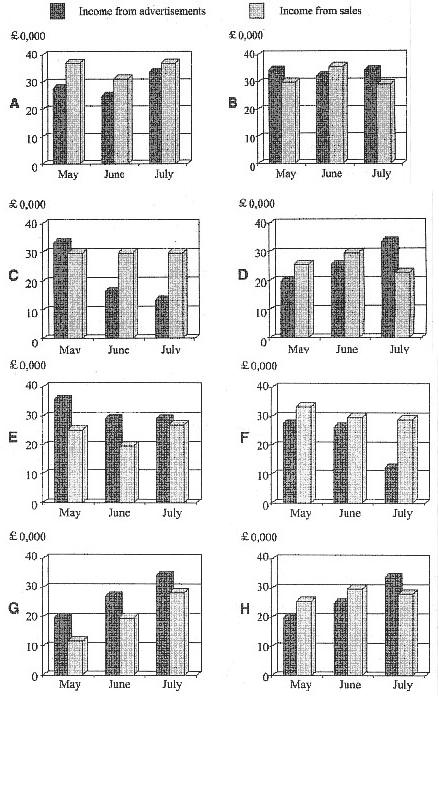
While income from advertisements rose steadily throughout the period, income from sales increased in June but then fell to below the May level.
第9题
?Which chart does each sentence (1 -5)describe?
?For each sentence, mark the correct letter(A--H)on your Answer Sheet.
?Do not use any letter more than once.

Bicycle sales hardly changed throughout the period, except for a slight fall in 199

 客服
客服
 TOP
TOP

 警告:系统检测到您的账号存在安全风险
为了保护您的账号安全,请在“上学吧”公众号进行验证,点击“官网服务”-“账号验证”后输入验证码“”完成验证,验证成功后方可继续查看答案!