重要提示:
请勿将账号共享给其他人使用,违者账号将被封禁!
重要提示:
请勿将账号共享给其他人使用,违者账号将被封禁!
 题目内容
(请给出正确答案)
题目内容
(请给出正确答案)
某数据集是关于美国60个著名的商学院的数据,包括的变量有GMAT分数(GMAT)、学费(Tuition)、进入MBA前后的工资(SalaPreMBA,SalaPostMBA)等等,其中有7个定量变量。利用R对这7个变量进行因子分析,运行结果如下。试根据结果回答下列问题: > data<-read.csv(file="bschool.csv", header="T,fileEncoding" "gb18030")> x = scale(data[,-c(1,2,10)]);mycor=cor(x);round(mycor,2) FiveYearGain FiveYearGp YearsToPayback SalaPreMBA SalaPostMBA Tuition GMAT FiveYearGain 1.00 0.69 -0.71 0.53 0.70 0.45 0.67 FiveYearGp 0.69 1.00 -0.95 -0.15 0.03 -0.24 0.13 YearsToPayback -0.71 -0.95 1.00 0.12 -0.02 0.16 -0.20 SalaPreMBA 0.53 -0.15 0.12 1.00 0.92 0.78 0.83 SalaPostMBA 0.70 0.03 -0.02 0.92 1.00 0.78 0.78 Tuition 0.45 -0.24 0.16 0.78 0.78 1.00 0.6 6GMAT 0.67 0.13 -0.20 0.83 0.78 0.66 1.00 > fa.parallel(x,fa="fa",main="碎石图")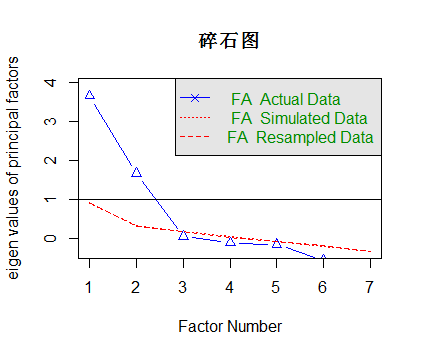 > fa.fit=fa(x,nfactors=4,rotate="varimax",fm="pa");fa.fit Factor Analysis using method = pa Call: fa(r = x, nfactors = 4, rotate = "varimax", fm = "pa")Standardized loadings (pattern matrix) based upon correlation matrix PA1 PA2 PA4 PA3 h2 u2 com FiveYearGain 0.62 0.76 0.16 0.13 1.00 -0.00058 2.1 FiveYearGp -0.07 0.98 -0.11 0.08 0.99 0.00984 1.1 YearsToPayback 0.04 -0.98 -0.02 0.13 0.98 0.02121 1.0 SalaPreMBA 0.98 -0.09 -0.07 -0.01 0.98 0.02018 1.0 SalaPostMBA 0.95 0.09 0.05 0.28 0.99 0.00803 1.2 Tuition 0.81 -0.14 0.39 0.01 0.82 0.17555 1.5 GMAT 0.86 0.21 0.01 -0.20 0.82 0.18004 1.2 PA1 PA2 PA4 PA3 SS loadings 3.65 2.58 0.19 0.16 Proportion Var 0.52 0.37 0.03 0.02 Cumulative Var 0.52 0.89 0.92 0.94 Proportion Explained 0.55 0.39 0.03 0.02 Cumulative Proportion 0.55 0.95 0.98 1.00 Mean item complexity = 1.3 Test of the hypothesis that 4 factors are sufficient. The degrees of freedom for the null model are 21 and the objective function was 11.65 with Chi Square of 650.43 The degrees of freedom for the model are -1 and the objective function was 0.01 The root mean square of the residuals (RMSR) is 0 The df corrected root mean square of the residuals is NA The harmonic number of observations is 60 with the empirical chi square 0 with prob < NA The total number of observations was 60 with Likelihood Chi Square = 0.3 with prob < NA Tucker Lewis Index of factoring reliability = 1.046 Fit based upon off diagonal values = 1 Measures of factor score adequacy PA1 PA2 PA4 PA3 Correlation of (regression) scores with factors 0.99 1.00 0.94 0.92 Multiple R square of scores with factors 0.99 1.00 0.89 0.84 Minimum correlation of possible factor scores 0.98 0.99 0.78 0.69 1) 该数据是否适合进行因子分析?为什么? 2) 选取几个公共因子比较合适?请给出原因。 3) 请给出学费的因子模型表达。
 更多“某数据集是关于美国60个著名的商学院的数据,包括的变...”相关的问题
第1题
某数据集是关于美国60个著名的商学院的数据,包括的变量有GMAT分数(GMAT)、学费(Tuition)、进入MBA前后的工资(SalaPreMBA,SalaPostMBA)等等,其中有7个定量变量。利用R对这7个变量进行因子分析,运行结果如下。试根据结果回答下列问题: > data<-read.csv(file="bschool.csv", header="T,fileEncoding" "gb18030")> x = scale(data[,-c(1,2,10)]);mycor=cor(x);round(mycor,2) FiveYearGain FiveYearGp YearsToPayback SalaPreMBA SalaPostMBA Tuition GMAT FiveYearGain 1.00 0.69 -0.71 0.53 0.70 0.45 0.67 FiveYearGp 0.69 1.00 -0.95 -0.15 0.03 -0.24 0.13 YearsToPayback -0.71 -0.95 1.00 0.12 -0.02 0.16 -0.20 SalaPreMBA 0.53 -0.15 0.12 1.00 0.92 0.78 0.83 SalaPostMBA 0.70 0.03 -0.02 0.92 1.00 0.78 0.78 Tuition 0.45 -0.24 0.16 0.78 0.78 1.00 0.6 6GMAT 0.67 0.13 -0.20 0.83 0.78 0.66 1.00 > fa.parallel(x,fa="fa",main="碎石图")> fa.fit=fa(x,nfactors=4,rotate="varimax",fm="pa");fa.fit Factor Analysis using method = pa Call: fa(r = x, nfactors = 4, rotate = "varimax", fm = "pa")Standardized loadings (pattern matrix) based upon correlation matrix PA1 PA2 PA4 PA3 h2 u2 com FiveYearGain 0.62 0.76 0.16 0.13 1.00 -0.00058 2.1 FiveYearGp -0.07 0.98 -0.11 0.08 0.99 0.00984 1.1 YearsToPayback 0.04 -0.98 -0.02 0.13 0.98 0.02121 1.0 SalaPreMBA 0.98 -0.09 -0.07 -0.01 0.98 0.02018 1.0 SalaPostMBA 0.95 0.09 0.05 0.28 0.99 0.00803 1.2 Tuition 0.81 -0.14 0.39 0.01 0.82 0.17555 1.5 GMAT 0.86 0.21 0.01 -0.20 0.82 0.18004 1.2 PA1 PA2 PA4 PA3 SS loadings 3.65 2.58 0.19 0.16 Proportion Var 0.52 0.37 0.03 0.02 Cumulative Var 0.52 0.89 0.92 0.94 Proportion Explained 0.55 0.39 0.03 0.02 Cumulative Proportion 0.55 0.95 0.98 1.00 Mean item complexity = 1.3 Test of the hypothesis that 4 factors are sufficient. The degrees of freedom for the null model are 21 and the objective function was 11.65 with Chi Square of 650.43 The degrees of freedom for the model are -1 and the objective function was 0.01 The root mean square of the residuals (RMSR) is 0 The df corrected root mean square of the residuals is NA The harmonic number of observations is 60 with the empirical chi square 0 with prob < NA The total number of observations was 60 with Likelihood Chi Square = 0.3 with prob < NA Tucker Lewis Index of factoring reliability = 1.046 Fit based upon off diagonal values = 1 Measures of factor score adequacy PA1 PA2 PA4 PA3 Correlation of (regression) scores with factors 0.99 1.00 0.94 0.92 Multiple R square of scores with factors 0.99 1.00 0.89 0.84 Minimum correlation of possible factor scores 0.98 0.99 0.78 0.69 1) 该数据是否适合进行因子分析?为什么? 2) 选取几个公共因子比较合适?请给出原因。 3) 请给出学费的因子模型表达。
第2题
bwght=119.77-0.514cigs
(i)当cigs=0时,预计婴儿的出生体重为多少?当cigs=20(每天一包)时呢?评价其差别。
(ii)这个简单回归能够得到婴儿出生体重和母亲抽烟习惯之间的因果关系吗?请解释。
(iii)要预测出生体重125盎司,cigs应该为多少?
(iv)样本中在怀孕期间不抽烟的妇女比例约为0.85。这有助于解释第(iii)部分中的结论吗?
第3题
A.BookMark类型的变量是一个对象指针,需要用 BookMark Create来建立
BookMark,用BookMark.free 来释放
B.BookMark本质上是一条记录类型,无须建立和释放
C.Delphi中,一个数据集组件只能建立一个书签 BookMark
第7题
 客服
客服
 TOP
TOP

 警告:系统检测到您的账号存在安全风险
为了保护您的账号安全,请在“上学吧”公众号进行验证,点击“官网服务”-“账号验证”后输入验证码“”完成验证,验证成功后方可继续查看答案!