重要提示:
请勿将账号共享给其他人使用,违者账号将被封禁!
重要提示:
请勿将账号共享给其他人使用,违者账号将被封禁!
 题目内容
(请给出正确答案)
题目内容
(请给出正确答案)
The chart shows car sales in Australia by colour.
Summarise the information by selecting and reporting the main features and by making comparisons where relevant.
Write at least 150 words.

 更多“The chart shows car sales in Australia by colour. Summarise the information by selecting a”相关的问题
第1题
You should spend about 20 minutes on this task.
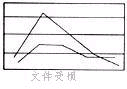
The line graph below gives information about the rates of unemployment between 1991 and 2005 in three different countries. The table shows the percentage of men and women in the workforce in the three countries.
Summaries the information by selecting and reporting the main features, and make comparisons where relevant.
Write at least 150 words.
Employment rates of men and women in Europe in 1991 ( working population as percentage of total population )
第2题
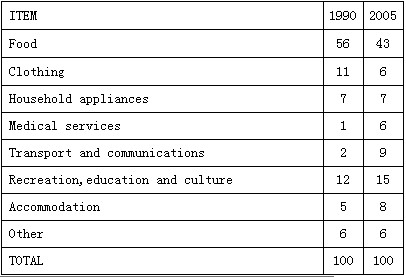
ese city in 1990 and 2005.
Summarise the information by selecting and reporting the main features and by making comparisons where relevant
Write at least 150 words.
第3题
WRITING TASK 1
You should spend about 20 minutes on this task.
The charts below show the levels of participation in education and science in developing and industrialised countries in 1980 and 1990.
Write a report for a university lecturer describing the information shown below.
You should write at least 150 words.
.jpg)
第4题
You should spend about 40 minutes on this task.
Write about the following topic:
Many of the worM's cities are currently facing a serious housing shortage.
What are some of the reasons for this shortage and what solutions can you suggest?
Give reasons for your answer and include any relevant examples from your own knowledge or experience.
Write at least 250 words.
第5题
You should spend about 40 minutes on this task.
Write about the following topic:
A number of tertiary courses require students to undertake a period of unpaid work at an institution or organization as part of their programmed.
What are the advantages and disadvantages of this type of course requirement?
Give reasons for your answer and include any relevant examples from your own knowledge or experience.
Write at least 250 words.
第6题
You should spend about 20 minutes on this task.
The pie charts below give information about the household expenditure of two average U.S. families in different years.
Summaries the information by selecting and reporting the main features, and make comparisons where relevant.
Write at least 150 words.

第7题
WRITING TASK 1
You should spend about 20 minutes on this task.
The graph below shows the unemployment rates in the US and Japan between March 1993 and March 1999.
Write a report for a university lecturer describing the information shown below.
You should write at least 150 words.
.jpg)
第8题
Write about the following topic:
In order to learn a language well, we should learn about the country as well as the cultures and lifestyles of the people who speak it.
To what extent do you agree or disagree?
Give reasons for your answer and include any relevant examples from your own knowledge or experience.
Write at least 250 words.
第9题
WRITING TASK 1
You should spend about 20 minutes on this task.
The charts below show the number of Japanese tourists travelling abroad between 1985 and 1995 and Australia's share of the Japanese tourist market.
Write a report for a university lecturer describing the information shown below.
You should write at least 150 words.
.jpg)
第10题
WRITING TASK 1
You should spend about 20 minutes on this task.
The flowchart below shows the process involved in writing a formal academic essay for a particular university course.
Describe the stages of the process in a report for a university lecturer.
Write at least 150 words.
.jpg)
 客服
客服
 TOP
TOP

 警告:系统检测到您的账号存在安全风险
为了保护您的账号安全,请在“上学吧”公众号进行验证,点击“官网服务”-“账号验证”后输入验证码“”完成验证,验证成功后方可继续查看答案!